Diversity and inclusion analytics
The diversity and inclusion section provides metrics that reflect diversity, inclusion, and other key indicators shaping organizational culture and identity. This document helps admins leverage the diversity and inclusion analytics dashboard to monitor workforce composition across gender, age, and other demographic attributes. It supports informed decision-making to promote a more inclusive, equitable, and diverse workplace.
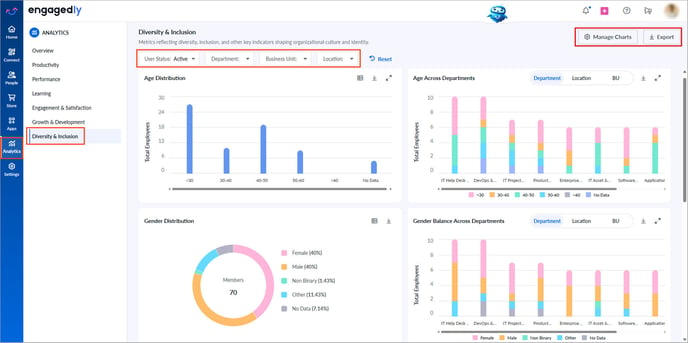
Navigate to Analytics > Diversity & Inclusion.
- At the top of the dashboard, filter data by employee status (active or blocked), departments, business units, and locations to view metrics based on your selections.
- At the top-right, click Export to download metrics from all visuals as a PDF.
- At the top right, click Manage charts, select the visuals you want to hide from the dashboard, and click Save.
Admins can hide visuals that are not relevant to them. However, they cannot rearrange charts or rename sections. Restore hidden charts at any time if required.

📒Notes:
- When you apply filters across multiple categories (such as department, business unit, and location), the system displays data only for employees who meet all the selected filters.
- When you select multiple values within the same filter, the system displays data for any or all of the selected values, depending on the data availability.
The diversity and inclusion analytics dashboard comprises multiple visuals. Each visual includes an export icon for downloading specific reports in PNG, PDF, or CSV format. Most of the visuals include time filters for customizing the data.
The visuals on the dashboard are interactive, allowing admins to click on charts to view more details and export them as required.
Visuals in diversity and inclusion analytics
Age distribution: Shows the total employees across different age groups. Helps understand generational representation and informs age-inclusive policies.
Age across department, location, or business unit: Shows age distribution based on the selected organizational unit. Aids in aligning age diversity with specific business areas for balanced workforce planning.
Gender distribution: Highlights the overall gender ratio within the organization. Assists in monitoring gender diversity and promoting gender equity across the organization.
Gender balance across department, location, or business unit: Shows gender representation based on the selected organizational unit. Enables targeted initiatives to improve gender diversity in specific teams or locations.
Ethnicity: Displays the number of employees belonging to various ethnic groups. Promotes awareness of ethnic representation and supports inclusive hiring practices.
Cultural diversity across department, location, or business unit: Shows cultural group representation based on the selected organizational unit. Helps ensure diverse cultural perspectives are present throughout different parts of the organization.
Strength in diversity: Displays the percentage of veterans and employees with disabilities. Reinforces the organization’s commitment to inclusion and accessibility.