Learning analytics provides admins with a holistic view of learning activity, offering insights into adoption, engagement, and the impact of learning and development initiatives. This document helps admins navigate the learning analytics dashboard, monitor engagement trends, and take timely action to improve learning outcomes. These insights support data-driven decisions that enhance learning adoption and workforce development.
Navigate to Analytics > Learning.
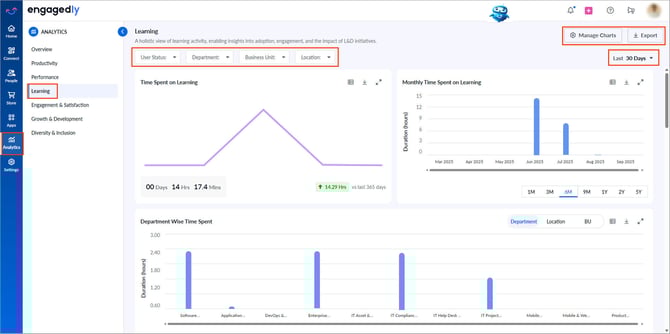
- At the top of the dashboard, filter data by employee status (active or blocked), departments, business units, and locations to view metrics based on your selections.
- At the top-right, select a period to update all visuals on the dashboard based on the selected time range.
- At the top-right, click Export to download metrics from all visuals as a PDF.
- At the top right, click Manage charts, select the visuals you want to hide from the dashboard, and click Save.
Admins can hide visuals that are not relevant to them. However, they cannot rearrange charts or rename sections. Restore hidden charts at any time if required.
📒Notes:
- When you apply filters across multiple categories (such as department, business unit, and location), the system displays data only for employees who meet all the selected filters.
- When you select multiple values within the same filter, the system displays data for any or all of the selected values, depending on the data availability.
The learning analytics dashboard comprises multiple visuals. Each visual includes an export icon for downloading specific reports in PNG, PDF, or CSV format. Most of the visuals include time filters for customizing the data.
The visuals on the dashboard are interactive, allowing admins to click on charts to view more details and export them as required.
Generate a summary
All time-based and organization-segment charts include Marissa, the AI assistant.
Click the Marissa ![]() icon on a chart to generate an AI-powered summary of key patterns and insights. The summary helps you quickly understand the chart without manually analyzing the data.
icon on a chart to generate an AI-powered summary of key patterns and insights. The summary helps you quickly understand the chart without manually analyzing the data.
Marissa highlights patterns, such as trends over time, peaks and lows, anomalies, and comparisons across time periods or organizational segments.
This enables admins to identify key productivity insights more efficiently.
Visuals in learning analytics
Time spent on learning: Shows total learning time over the last 30 days. You can nudge learners to encourage participation. Helps measure current engagement levels and identify learning trends across the organization.
Monthly time spent on learning: Displays month-wise time. You can nudge learners to encourage participation. Identifies periods of high or low engagement to better plan training activities.
Department, location, or business unit-wise time spent: Displays learning time based on the selected organizational unit. You can nudge learners to encourage participation. Provides insights into which teams or regions are most and least engaged in learning.
Most engaged learners: Highlights top learners based on time spent or number of courses enrolled. You can award points to recognize them. Helps identify and reward high performers to foster a culture of continuous learning.
Least engaged learners: Identifies learners with minimal engagement based on time spent or course enrollments. You can nudge learners to encourage participation. Flags individuals who may need support or motivation to improve learning outcomes.
Compliance course completion: Displays completion rates for compliance courses and counts of compliant and non-compliant courses. You can nudge learners to encourage participation. Helps ensure the organization meets regulatory training requirements.
Department, location, business unit-wise compliance course completion: Shows completion rates for compliance courses based on the selected organizational unit. You can nudge learners to encourage participation. Identifies areas that may require targeted compliance initiatives.
Mandatory training completion: Shows the percentage of mandatory training completion and the number of completed and pending enrollments. You can nudge learners to encourage participation. Tracks mandatory training adoption to ensure operational readiness and risk mitigation.
Department, location, or business unit-wise mandatory training completion: Mandatory training completion based on the selected organizational unit. Enables targeted follow-up to improve mandatory training compliance.
Most popular courses: Lists the most enrolled courses during the selected time frame. Helps understand employee learning interests and content effectiveness.
Least popular courses: Lists courses with the fewest enrollments in the selected period. Highlights underused content that may need re-evaluation or better promotion.
Course rating: Shows the total number of courses and their average ratings. Gauges course quality to maintain and improve learning content.
Department, location, business unit-wise course rating: Displays course ratings based on the selected organizational unit. Reveals training satisfaction levels across the organization.
Enrollments (Self vs assigned): Compares the number of learners who self-enrolled versus those assigned to courses. Indicates learner initiative versus mandatory participation.
Department, location, business unit-wise Enrollments (Self vs assigned): Shows the number of enrollments based on the selected organizational unit.
Most self-guided learners: Highlights learners who spent the most time on self-enrolled courses. Identifies proactive learners and potential internal champions for learning and development initiatives.