Performance analytics
Performance analytics provides admins with a comprehensive view of trends across review cycles, including insights into review outcomes, progress, and key performance indicators (KPIs). This document helps admins navigate the dashboard and make data-driven decisions related to talent development, succession planning, and workforce optimization by understanding performance trends, risk levels, and employee potential.
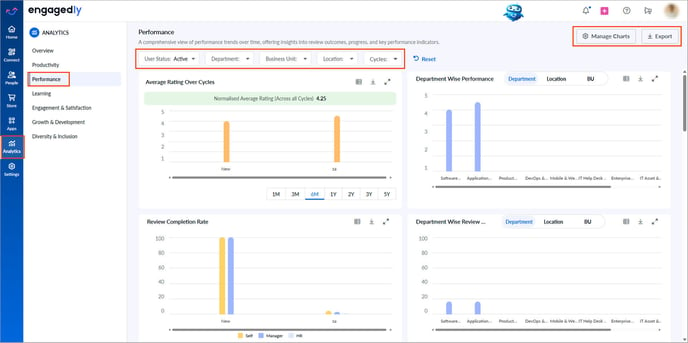
Navigate to Analytics > Performance.
- At the top of the dashboard, filter data by employee status (active or blocked), departments, business units, locations, and review cycles to view metrics for a specific cycle.
- At the top-right, click Export to download metrics from all visuals as a PDF.
- At the top right, click Manage charts, select the visuals you want to hide from the dashboard, and click Save.
Admins can hide visuals that are not relevant to them. However, they cannot rearrange charts or rename sections. Restore hidden charts at any time if required.

📒Notes:
- When you apply filters across multiple categories (such as department, business unit, and location), the system displays data only for employees who meet all the selected filters.
- When you select multiple values within the same filter, the system displays data for any or all of the selected values, depending on the data availability.
The performance analytics dashboard comprises multiple visuals. Each visual includes an export icon for downloading specific reports in PNG, PDF, or CSV format. Most of the visuals include time filters for customizing the data.
The visuals on the dashboard are interactive, allowing admins to click on charts to view more details and export them as required.
If a single cycle is selected, the average rating, review completion rate of all participants, and assignment rate are displayed at the top.
Visuals in performance analytics
📒Note: All ratings are normalized to a standard scale of 1 to 5 for consistency across review cycles.
Average rating over cycles: Displays the average normalized manager rating for each review cycle. Helps track performance trends over time and assess the effectiveness of performance strategies.
Department, location, or business unit-wise performance: Displays average performance ratings based on the selected organizational unit. Enables department-level comparisons for equitable talent management.
Review completion rate: Shows the percentage of reviews completed by all participants. Ensures review cycle efficiency and full stakeholder participation.
Department, location, or business unit-wise review completion: Shows the review completion rate based on the selected organizational unit. Helps ensure accountability and consistency in the review process across departments, locations, or business units.
Rating distribution: Shows the distribution of ratings across all historical review cycles, including the total number of employees and their average normalized ratings. Enables performance calibration and identification of rating trends or biases.
Review assigned vs completed: Displays the number of reviews assigned and completed. Tracks review participation and helps reduce process delays.
High performers: Lists employees consistently rated as top performers based on historical performance data. Facilitates succession planning, rewards, and recognition programs.
Low performers: Lists employees consistently rated as underperformers based on historical performance data. Identifies employees who may need development plans or performance improvement strategies.
Performance breakdown: Classifies employees into top, average, and at-risk performers using all historical performance data. Provides a comprehensive view of overall workforce health.
Employee percentage by risk across all departments, locations, business units: Displays the percentage of employees at varying risk levels based on the selected organizational unit. Enables targeted interventions by highlighting areas or teams that may need additional support, development, or realignment.
Employee risk rating: Shows how many employees fall into high, medium, or low risk categories based on review data. Supports proactive talent management by allowing HR and managers to address potential issues before they impact team productivity or morale.
Performance insights: Visualizes employee performance and potential using the 9-box matrix. Aids in strategic talent decisions like promotions, development, and retention.
Performance rating by gender: Displays the average normalized performance rating by gender. Promotes fair and equitable performance evaluation practices.
Performance rating by management level: Shows the average normalized rating segmented by management level. Supports leadership performance evaluation and development tracking.
Performance rating by ethnicity: Displays the average normalized performance rating by race or ethnicity. Helps ensure diversity, equity, and inclusion in performance ratings.