Productivity is a key metric in the HR domain that offers admins insights into goal progress and achievements across various levels of the organization, helping them track alignment and execution effectiveness. This document helps admins understand and utilize the productivity analytics dashboard to monitor goal progress, track employee achievements, and assess collaboration levels through meetings.
Navigate to Analytics > Productivity.
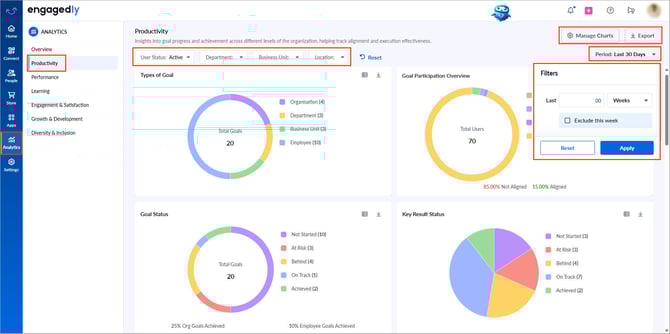
- At the top of the dashboard, filter data by employee status (active or blocked), departments, business units, and locations to view metrics based on your selections.
- At the top-right, click Export to download metrics from all visuals as a PDF.
- At the top-right, open the Period drop-down to set the time range for updating all visuals on the dashboard.
Based on the selected time range, enable Exclude to omit a specific day, week, month, quarter, or year. - At the top right, click Manage Charts, select the visuals you want to hide from the dashboard, and click Save.
Admins can hide visuals that are not relevant to them. However, they cannot rearrange charts or rename sections. Restore hidden charts at any time if required.
The global period filter allows you to control the time range for all applicable charts and visuals in the analytics dashboard simultaneously. It helps you view insights consistently and reduces the need for adjusting multiple filters.
Use the global time filter to:
- Choose predefined time ranges, such as last n days, weeks, months, quarters, or years.
- View all available historical data.
- Select a custom start and end date for detailed analysis.
📒Notes:
- When you apply filters across multiple categories (such as department, business unit, and location), the system displays data only for employees who meet all the selected filters.
- When you select multiple values within the same filter, the system displays data for any or all of the selected values, depending on the data availability.
The productivity analytics dashboard comprises multiple visuals. Each visual includes an export icon for downloading specific reports in PNG, PDF, or CSV format. Most of the visuals include time filters for customizing the data.
The visuals on the dashboard are interactive, allowing admins to click on charts to view more details and export them as required.
Generate a summary
All time-based and organization-segment charts include Marissa, the AI assistant.
Click the Marissa ![]() icon on a chart to generate an AI-powered summary of key patterns and insights. The summary helps you quickly understand the chart without manually analyzing the data.
icon on a chart to generate an AI-powered summary of key patterns and insights. The summary helps you quickly understand the chart without manually analyzing the data.
Marissa highlights patterns, such as trends over time, peaks and lows, anomalies, and comparisons across time periods or organizational segments.
This enables admins to identify key productivity insights more efficiently.
Visuals in productivity analytics
Types of goal: Displays the breakdown of all goal types: organization, employee, department, and business unit goals. Enables a better understanding of goal distribution across the organization for strategic alignment.
Goal participation overview: Displays how many employees have created goals, have drafts, or have no goals at all. It also shows alignment status. Boosts accountability by identifying teams or individuals lagging in goal-setting engagement.
Goal status: Displays the status of goals based on progress. Also shows the percentage of organization goals and employees who have achieved them. Organization goals reflect overall progress and distribution of goal statuses. You can nudge employees whose goal statuses are not started or at risk. Helps track organizational goal alignment and identify employees who need support or motivation.
Key result status: Tracks the progress of key results tied to goals, indicating whether they are achieved, on track, or behind. Validates execution by tracking measurable outcomes tied to strategic goals.
Goals achieved over time: Shows the percentage of goals achieved over a selected period. Use the time filter to adjust the view. You can nudge employees whose goal statuses are not started or at risk. Offers visibility into goal achievement trends and progress momentum over time.
Goal status across departments, locations, or business units: Displays the total number of goals categorized based on the selected organizational unit. You can nudge employees whose goal statuses are not started or at risk. Supports performance monitoring at the organizational unit level to drive targeted interventions.
Users with most goals achieved: Lists employees who have achieved the highest number of goals. Recognizes high performers and identifies employees for talent development decisions.
User with least goals achieved: Lists employees who have achieved the fewest goals. You can nudge them to encourage progress. Recognizes high performers and identifies employees who may need coaching or support.
📒Note: If sufficient data is available, the “Users with most goals achieved” and “Users with least goals achieved” visuals display the top five employees.
Progress update done over time: Shows how frequently employees progress is updated on their goals and the average number of check-ins per goal. Measures goal engagement and promotes a culture of continuous progress and accountability.
Progress update health: Tracks the recency and frequency of goal progress updates. Helps leaders identify inactive or stagnant goals, ensuring accountability and timely interventions to keep objectives on track.
Sections in meetings analytics
The meetings analytics dashboard helps assess collaboration levels and optimize meeting practices to improve time efficiency.
Network and collaboration: Visualizes connections between departments or business units through meetings. The line thickness represents the number of meetings, helping you assess team connectivity and improve cross-functional collaboration.
Discussion points completed: Shows the total number of discussion points marked as completed during meetings and pending discussion points. Offers insight into how effectively meetings are being followed through, ensuring that decisions and action items are addressed on time.
Discussion points distribution: Identifies the sources of discussion points, such as goals, IDPs, and feedback. It highlights the key drivers of employees’ meeting agendas and their alignment with organizational goals.