Home > Learning
This chart shows the visual representation of the overall time spent by you on courses.
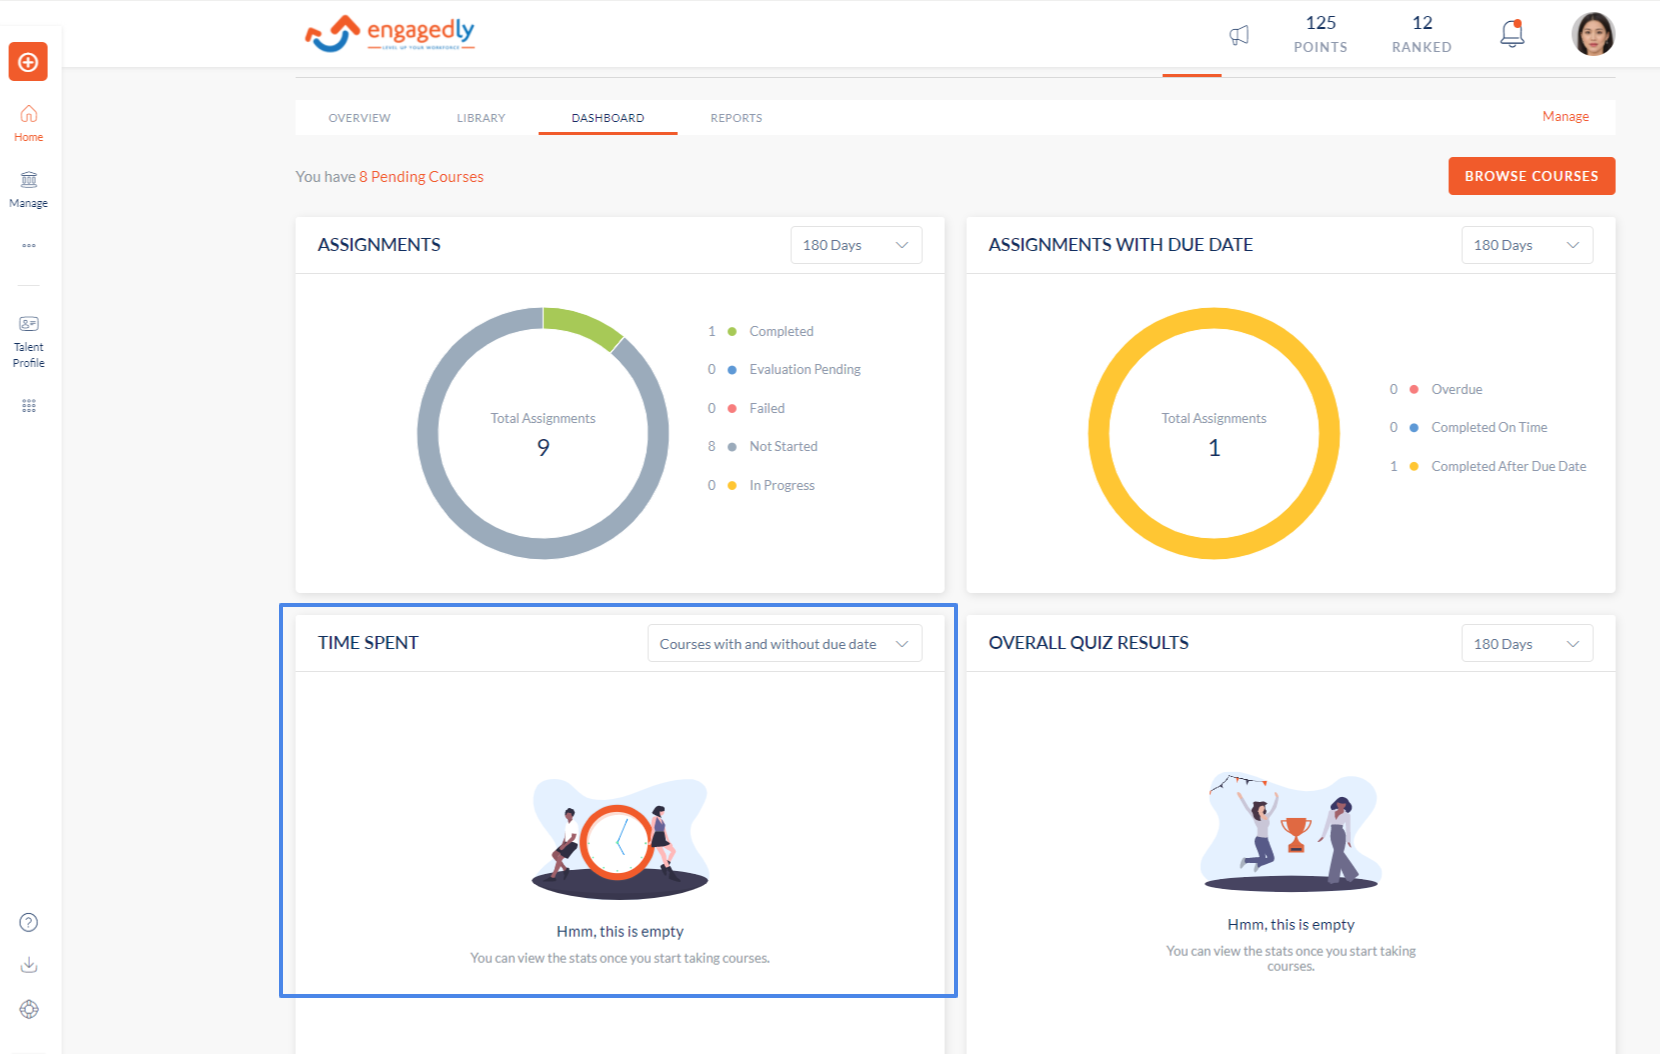
- Click the Dashboard tab.
- Navigate down to the Time spent chart.
- You can view the time spent by you upto a period of six months.
Note: The 6 month period is calculated by the current month plus 5 months prior.
- The graph can be sorted based on:
- Courses with due dates - courses you have enrolled in which have due dates.
- Courses without due dates - courses you have enrolled in which do not have due dates.
- Courses with and without due dates - Shows your entire time spent on courses.