Navigation: Home > Learning
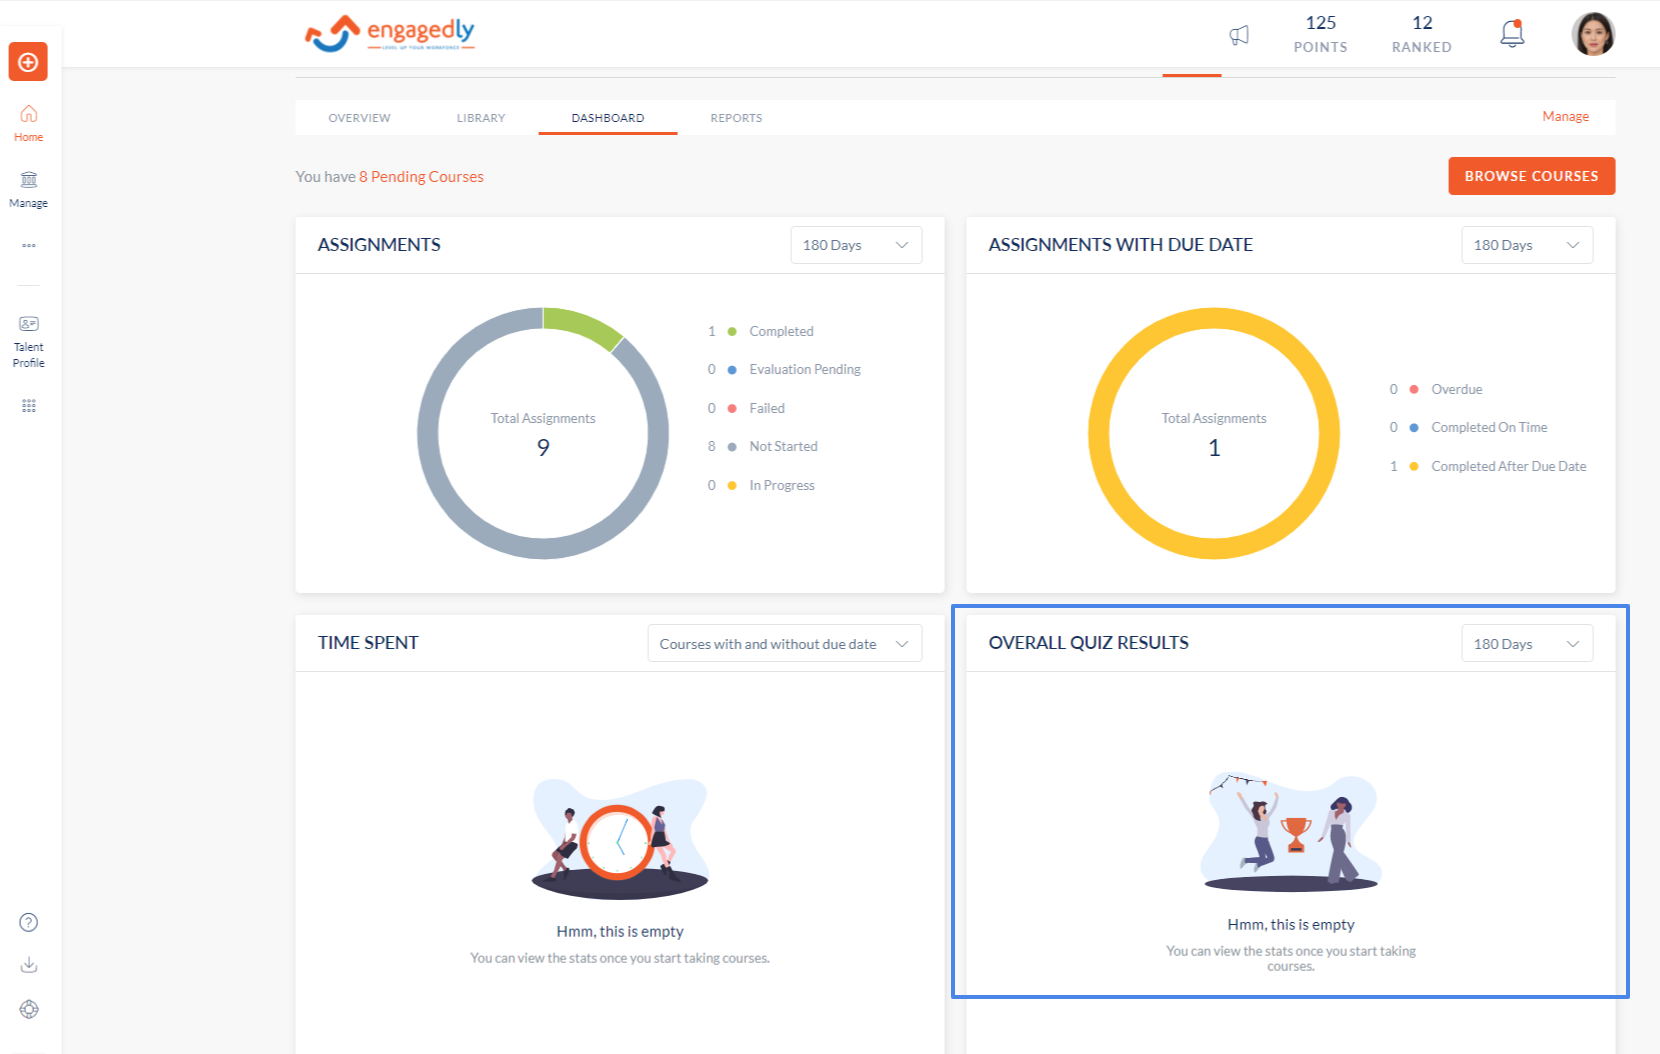
This chart shows the graphical representation of how you have performed in courses that have quizzes.
- Click the Dashboard tab.
- Navigate down to the Overall quiz results chart.
- The chart is categorized to show the following information:
- Passed Quizzes - Quizzes passed in courses taken by you.
- Failed Quizzes - Quizzes failed in courses taken by you.
- You can hover over the graph to see the details on that section of the graph.
Note: Clicking on the graph will take you to the root of the data where you can see the detailed information.